Information:
Site Statistics at Creativyst.com
Data and discussion on access statistics at creativyst.com
Current Statistics
Traffic here at the site is
to trending slowly upward. I've been adding new tools, products, original
articles and papers, and other content on a fairly regular basis. The
following chart is updated once a day and represents the site's traffic.
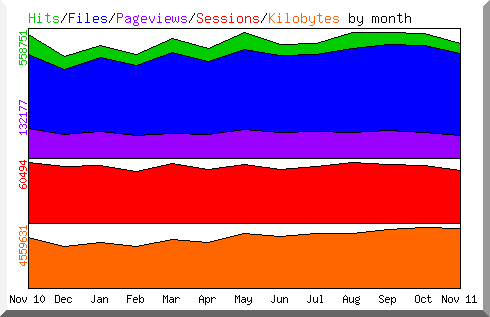
updated daily
The numbers on the left side are the
peak values for the entire chart. The right-most
traces are supposed to represent the extrapolated counts for the current
month (based on daily numbers averaged over the days that have passed, and
multiplied by the number of days in the month).
It counts the current day when doing these averages, even
though numbers have not yet been accumulated for the current day (it runs
early in the morning). This causes the trace to be low early in the month
(a bug?) when the current day effects the average strongly.
The chart itself shows the changes in these numbers (month to month) over the
past 12 months.
Hits
are
almost meaningless for us. They count every single request made to the server
including requests made for each graphic on a page, as well as cached items.
For this reason they will tend to be skewed low here relative to other sites
because this site uses very few small graphics files (such as rounded table
corners and spacers) to compose our pages.
The most important values for analysis are Page
Views, and Sessions.
Page Views counts the number of full pages
that have been sent to visitors. These don't care how many or how few other
objects are on the page. One page --no matter how many requests the browser
makes for graphics and scripts in order to display it-- is counted exactly
once.
Starting on 22-July-2003 our stats began to include dynamically loaded pages as
part of the page views number. Because many of the pages at this site are
generated dynamically, this new counting method has greatly improved the
accuracy of the "page views" number on the chart. This also explains
the sudden jump in page views relative to other counts on the chart at that
time. Keep in mind that when analyzing trends, one should consider both
page views and sessions.
Sessions counts the number of visitor
sessions recorded at the site. This can be thought of as the number of unique
visitors, where uniqueness is determined with the aid of a one-hour window.
For example, if a visitor comes into a product page from a search engine,
clicks through to the home page, clicks again to view the forums, clicks
to our contact page to send an inquiry, and then finally goes back to the
search engine, this will count as one single session.
The session window for our statistics is one hour, so, if the
visitor remembers something else he or she wanted to ask 20 minutes later and
returns to the site to send another inquiry, it will still be counted as part
of the same session. For us, the "Sessions" value is by far the most reliable
statistic for analyzing site traffic. But must be understood in context.
This Month

updated daily
The month chart shows a set of bar charts for each day of the current month.
The daily set of bars are presented for each statistic type with numbers on the
left showing current highest (peak) values.
The Week

updated daily
Agents
updated daily
The most compelling reason to study agents is that one day, the older browsers
will stop being used to access our site's content. We can then finally begin
to concentrate on building web pages that are mostly standard.
There will likely always be some need to do things outside of the standards,
just because the standards are concerned with doing things that have
already been done. Still, one should be intimately aware of the rules
of the trade, if for no other reason than so they may be broken with style.
|